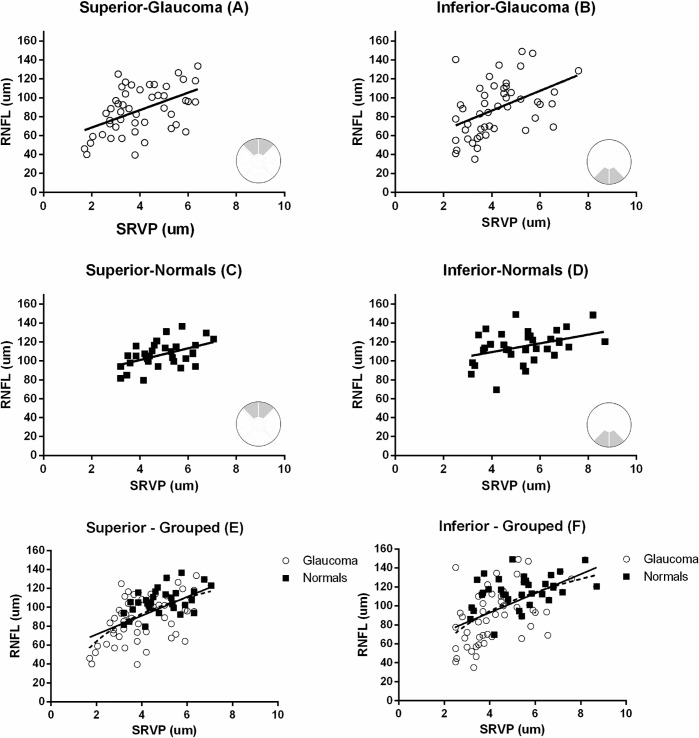
Fig 3. The relationship between mean RNFL thickness and mean SRVP amplitude for corresponding regions (A-D).
Grouped analysis for glaucoma subjects and normal controls in both sectors are also shown (E,F). inear regression and correlation coefficient in each sector were A) RNFL = 9.2SRVP+50, r = 0.48, p<0.001, B) RNFL = 10.4SRVP+44.5, r = 0.44, p<0.001, C) RNFL = 6.2SRVP+76, r = 0.48, p<0.001, D) RNFL = 4.6 SRVP+90.8, r = 0.38, p<0.01, E) RNFL = 9.9SRVP+51,r = 0.55, p<0.0001 and F) RNFL = 10.1SRVP+52, r = 0.51, p<0.0001. or the grouped data both a linear and a non-linear regression are shown – solid line = linear, dashed line = non-linear. Goodness of fit for non-linear regression on panels E and F were r2 = 0.35 and 0.3 respectively.

