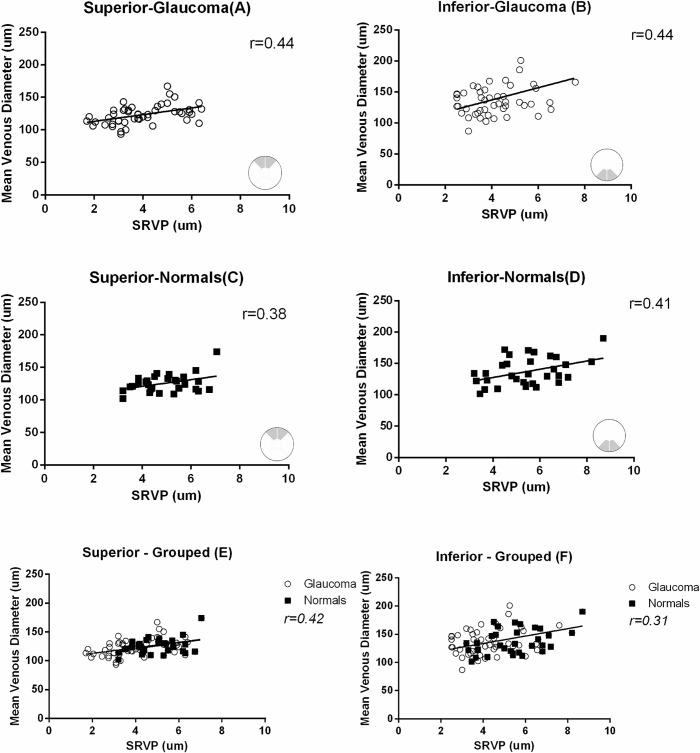
Fig 5. Correlation between average SRVP amplitude and mean venous diameter in the superior and inferior sectors both in glaucomatous and normal eyes.
Grouped analysis for glaucoma subjects and normal controls in both sectors are also shown (E,F). Correlation coefficient for A,B,C, D,E and F are r = 0.44,0.44,0.36,0.41,0.42 and 0.31.

