
Fig. 2.
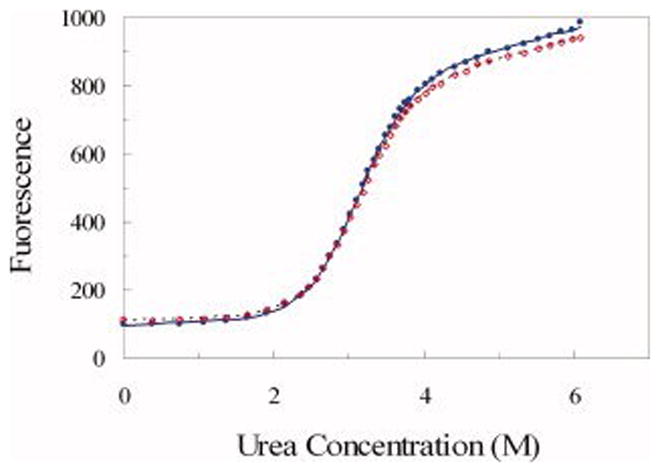
Fitting of FKBP tryptophan fluorescence under urea denaturation to equation (1). Two sets of data from repeat experiments in the presence of 100 g/l dextran 40 kD are shown as circles and diamonds, respectively. The fits, shown as solid and dotted curves, were done with floating m; the fitted values of m and ΔG are listed in Table 1.