
Fig. 5.
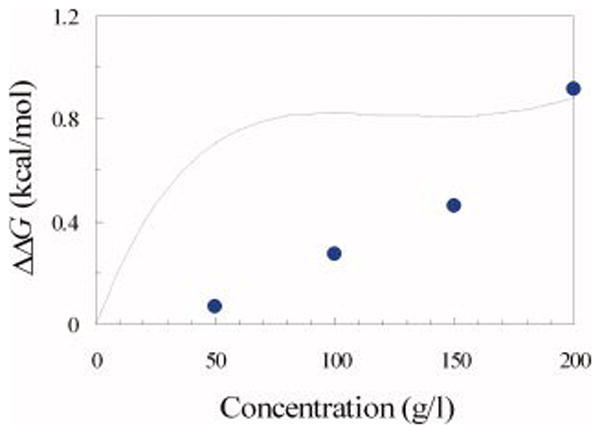
The change in the unfolding free energy of FKBP by dextran 6 kD. Circles show the measured ΔΔG values. The curve is the theoretical prediction, with the parameters listed in the legend of Figure 4.
Official websites use .gov
A
.gov website belongs to an official
government organization in the United States.
Secure .gov websites use HTTPS
A lock (
) or https:// means you've safely
connected to the .gov website. Share sensitive
information only on official, secure websites.
The change in the unfolding free energy of FKBP by dextran 6 kD. Circles show the measured ΔΔG values. The curve is the theoretical prediction, with the parameters listed in the legend of Figure 4.