
Figure 4. FOXA1 and NKX3-1 positively regulate DRAIC.
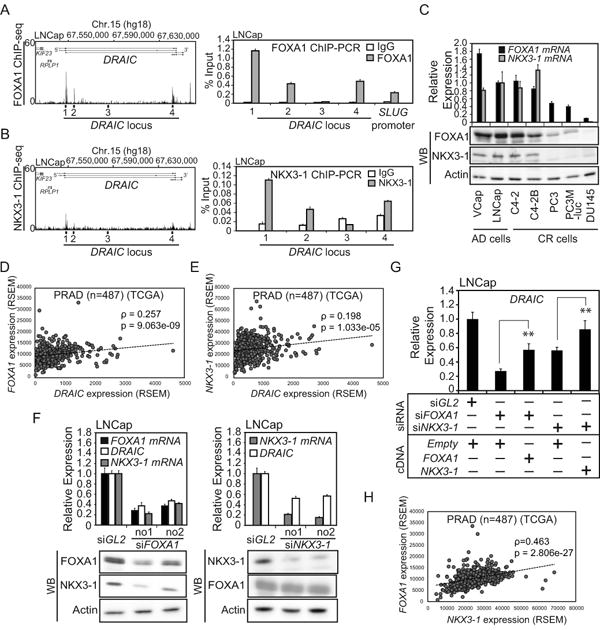
(A) Left: Published FOXA1 ChIP-seq (26) peaks in LNCap cells cultured in the growth medium. Right: FOXA1 ChIP-PCR was performed with cells in 10% FCS. SLUG promoter was used as a positive control (32). Rest as in Fig. 3D. (B) Left: Published NKX3-1 ChIP-seq (27) peaks in LNCap cells treated with Dihydrotestosterone (DHT). Rgith: NKX3-1 ChIP-PCR was performed with cells in 10% FCS. Rest as in Fig. 3D. (C) The mRNA and protein levels of FOXA1 and NKX3-1 were measured by RT-qPCR and western blotting, respectively. Rest as in Fig. 1C. (D and E) The correlation of levels of DRAIC and FOXA1 or DRAIC and NKX3-1 RNAs in prostate adenocarcinoma (PRAD) samples (n=487) from tier-3 RNA-seq data of TCGA. Spearman correlation coefficients and p-values are shown. (F) LNCap cells cultured in growth medium were transfected with siRNA against FOXA1, NKX3-1 or siGL2 for 72h. The RNA levels of DRAIC, FOXA1 and NKX3-1 and the protein levels of FOXA1, NKX3-1 and Actin were measured by RT-qPCR and western blotting, respectively. In RT-qPCR, the expression in siGL2 is set as 1. Rest as in Fig. 1C. (G) LNCap cells cultured in the growth medium were transfected with siRNA against FOXA1 no.1, NKX3-1 no.1 or siGL2 and 3μg expression vector of pcDNA3-FOXA1, -NKX3-1 or -Empty for 72 h. The expression of DRAIC was measured by RT-qPCR. The expression of DRAIC in siGL2 plus Empty vector cells is set as 1. ** indicates p-value<0.01. Rest as in Fig. 1C. (H) The correlation curve between FOXA1 and NKX3-1 RNAs in prostate adenocarcinoma (PRAD) samples (n=487). Rest as in Fig.4D, E.