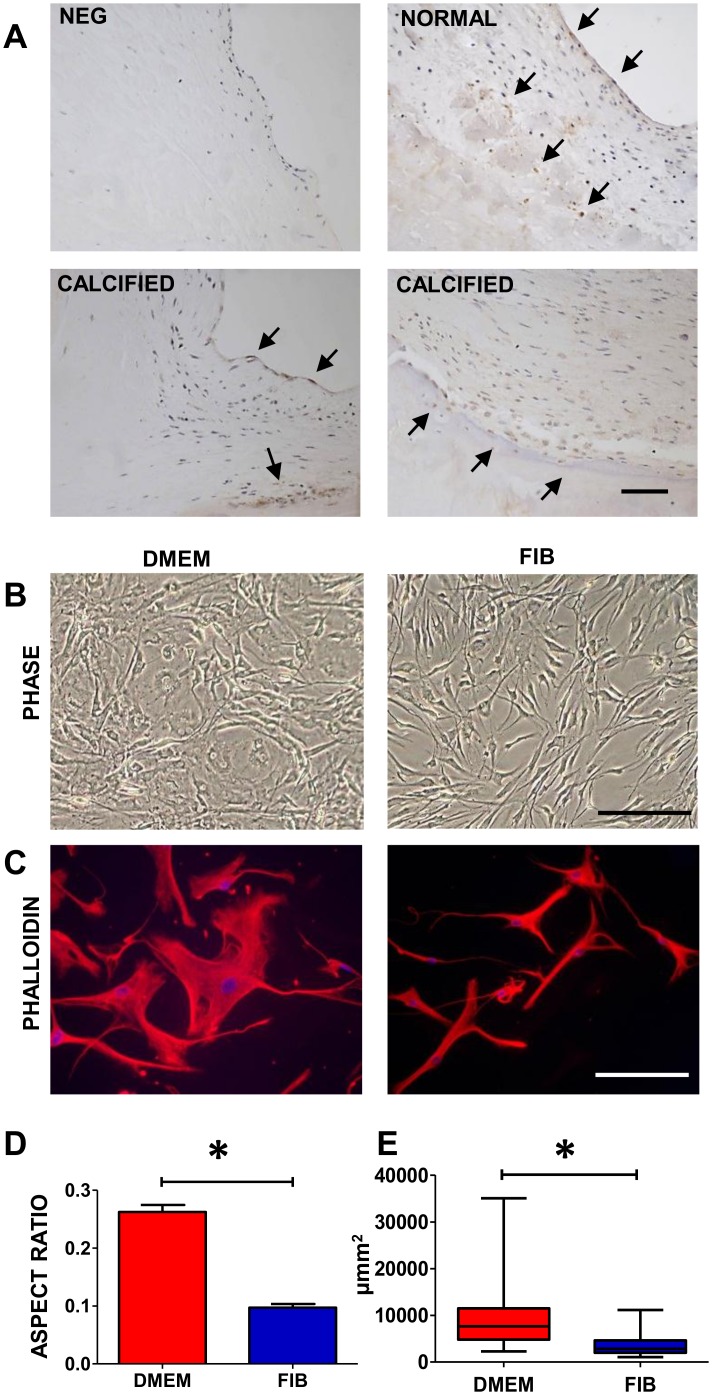
Fig 1. Top panels show a negative control and immunostaining with FGF2 antibody in normal aortic valve leaflets and bottom panels show expression of FGF2 in calcified valves (A); phase contrast images of VICs in DMEM and fibroblast media (B); staining with phalloidin (C), and graphs showing the aspect ratio and cell size (D).
Data labelled as FIB is from VICs that were switched to fibroblast media for 2 weeks prior to analysis. Scale bars represent 200μm in A, 50μm in B and 100μm in C. * P< 0.001.

