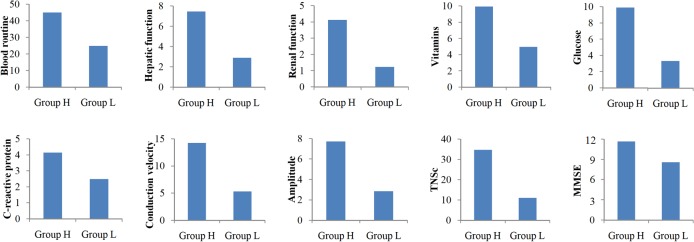
Fig 1. Percentage of abnormal cases by Group H and Group L in 2009–2011.

The eight bar charts showed that the percentages of abnormal cases of major health indicators, including blood routine, hepatic function, renal function, vitamins, glucose, C-reactive protein, TNSc, MMSE, conduction velocity and amplitude, were higher in Group H than in Group L.
