
Fig 5. Prediction of combination effects.
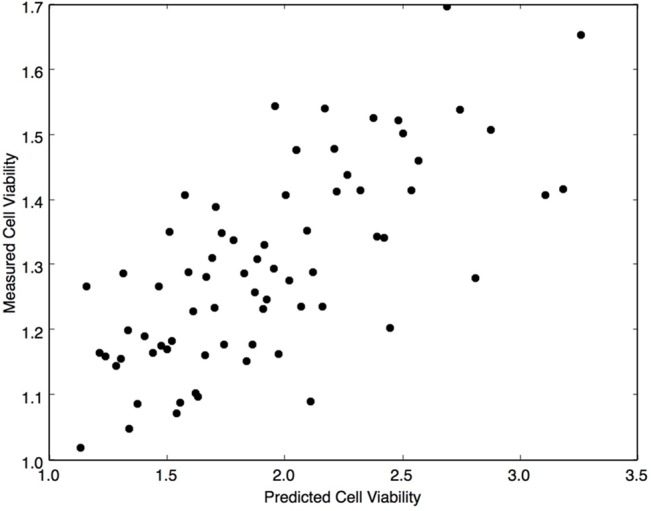
The correlation between KIEN combinatory predictions and experimental results are shown. Each dot corresponds to the myoblast viability obtained from 72 combinations between four drugs: G13, O20, I15, and K10 (R2 = 0.70, P<0.00001).