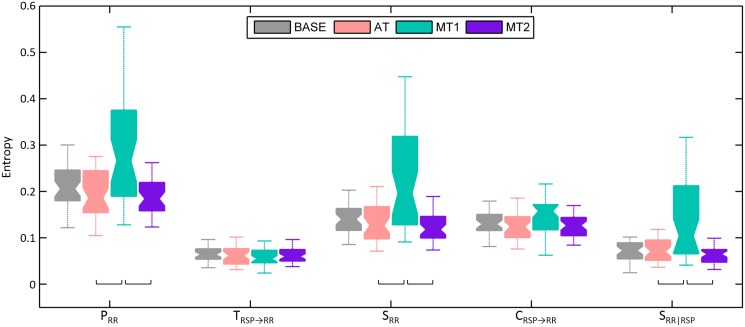
Fig 4. Boxplots of mean information-theoretic measures P RR (p < 0.01), T RSP → RR (p > 0.05), S RR (p < 0.001), C RSP → RR (p > 0.05) and S RR|RSP (p < 0.01), estimated using the model-free approach using the linear surrogates as input, during baseline (BASE), sustained attention (AT) and the mental stress tasks (MT1 and MT2).
The square brackets indicate significant differences between those two mental states as determined by the Friedman test and post hoc contrasts.

