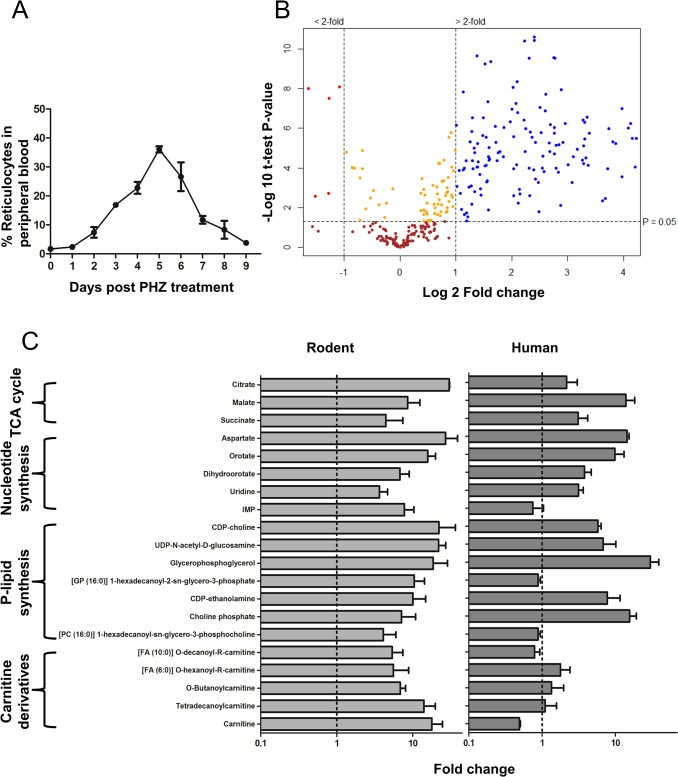
Fig 1. Comparison of Reticulocyte enriched Erythrocyte Population (REP) and wild type Erythrocyte Population (wtEP) reveals metabolite enrichment in rodent and human reticulocytes.
A. Dynamics of reticulocyte enrichment in peripheral blood in vivo followed by Phenylhydrazine-HCl (phz) treatment of mice. Reticulocytes were harvested at day 5 post phz treatment. The error is given as the standard deviation (S.D.) of 3 independent biological replicates. B. Volcano plot showing distribution of putative metabolites according to their fold change in abundance in REP vs wtEP in rodent blood. All significant changes are represented above the broken horizontal line. Coloured dots indicate metabolites which are: Blue- significantly up-regulated, Red- significantly down-regulated, Yellow- significant but little change, Brown- non-significant. n = 3 independent biological replicates (with four internal technical replicates each). Significance tested by Welch’s T-test (α < 0.05). See Fig A-C in S1 Text and S1 Table in for the complete list of detected metabolites and their respective abundance fold changes. C. Representative metabolites up-regulated in reticulocytes compared to mature erythrocytes in human and rodent erythrocytes. Relative levels (peak intensities) are expressed as fold change observed in reticulocyte vs mature erythrocytes. Dotted line indicates no change and error bars indicate R.S.D. (Relative Standard Deviation) of peak intensities from reticulocyte samples multiplied to the fold change values from n = 3 independent biological replicates.

