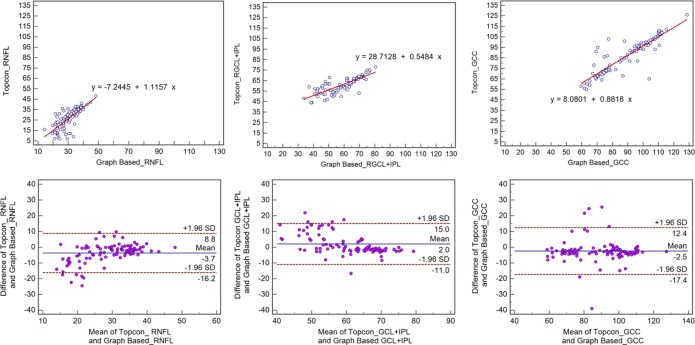
Fig 3. Scatter plots and Bland-Altman plot for glaucoma subjects.
First row: Scatter plots demonstrating the correlation between the Topcon algorithm and the graph-based algorithm with respect to retinal GCC thickness. Second row: Bland-Altman plot demonstrating the agreement between the Topcon algorithm and the graph-based algorithm with respect to retinal GCC thickness.

