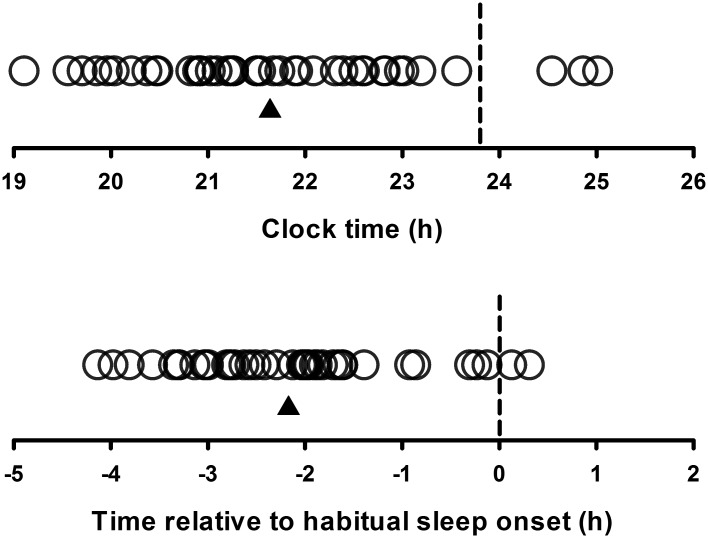
Fig 2. Timing of melatonin onset (circles) for each participant (n = 43) relative to clock time (upper panel) and relative to sleep onset (phase angle of entrainment; lower panel).
Dashed line represents mean time of sleep onset and the triangle represents the mean melatonin onset time for all participants. A subset of these data (n = 28) has been published previously [24].

