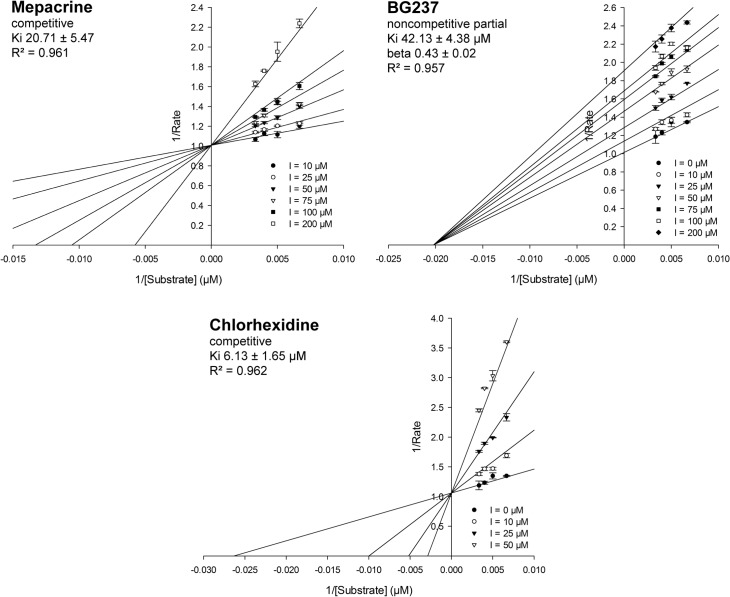
Fig 3. TR assay validation—Lineweaver-Burk plots for known inhibitors.
The Ki values were determined by three independent experiments. Mepacrine: measured Ki 20.71 ± 5.47 μM, competitive binding mode; BG237: measured Ki 42.13 ± 4.38 μM, noncompetitive binding mode, partial. The factor beta reflects the modification of the rate of product formation by the enzyme that is caused by the inhibitor. Chlorhexidine: measured Ki 6.13 ± 1.65 μM, competitive binding mode. Graphs are created using the SigmaPlot Enzyme Kinetics Module routine based on the relevant binding models and the calculated parameter values.

