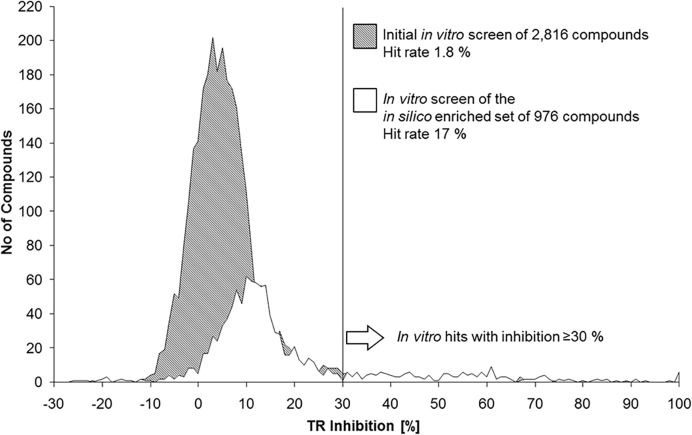
Fig 5. Inhibition distribution of the in vitro screenings.
The number of compounds is plotted against the percentage of TR inhibition. The grey area represents the activity distribution of the compounds in the initial screening, while the white area shows the distribution of the second in vitro screening based on the in silico enriched focused data set. The overall activity of the in silico enriched data set is shifted to the right compared to the initial diverse in vitro screen data set. Importantly, the second screen delivered more in vitro hits with an inhibitory potency of ≥30% although this data set was 3 times smaller.

