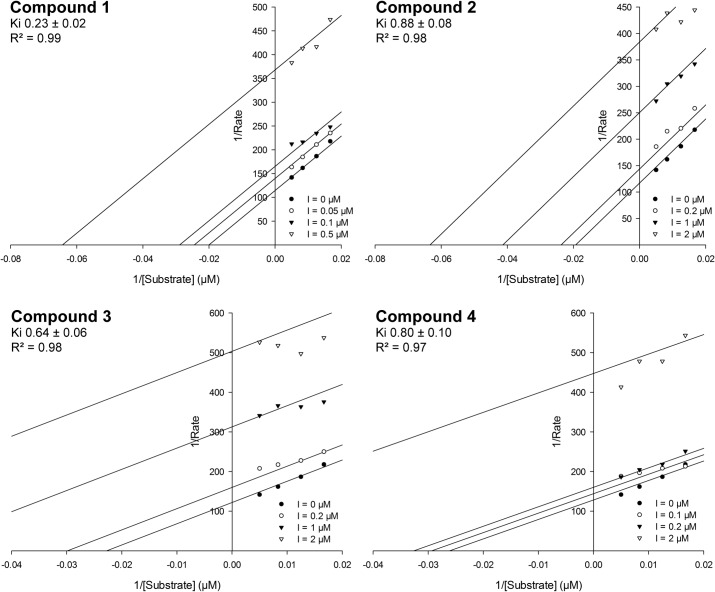
Fig 7. Lineweaver-Burk plots for the most active compounds assuming an uncompetitive mode of inhibition.
The Ki values represent the mean of two independent experiments; standard deviations are based on fitted plots. Data analysis has been performed using the Enzyme Kinetics Module of SigmaPlot, which fits the experimental data to the selected binding model.

