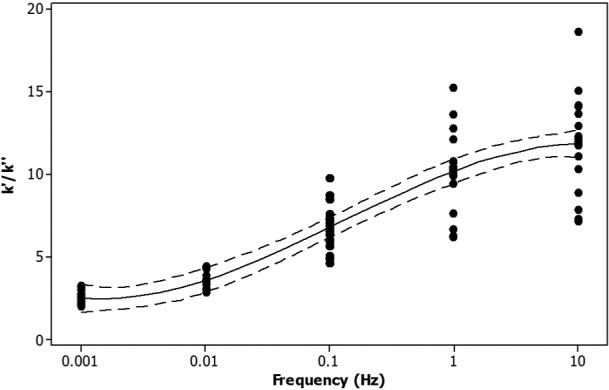
Figure 4.

Ratio of storage (k′) to loss (k″) stiffness against the logarithm of the frequency. All data points are included (black circles), along with the mean trendline (solid line) and 95% confidence intervals (dashed line). Note that 95% confidence intervals refer to the reliability of the procedure used and not to the likelihood that an individual data point will appear within that range or that 95% of data points are found within that range.35
