
Figure 3.
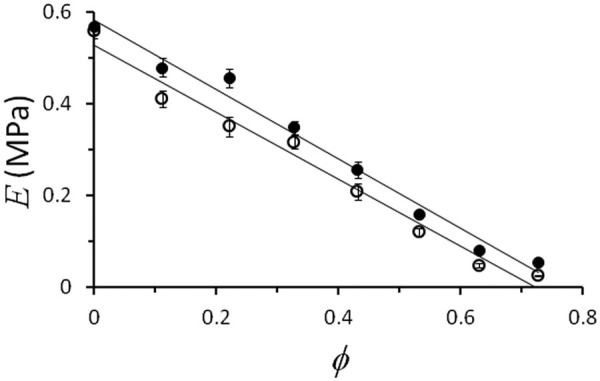
Young’s modulus, E (MPa), plotted against the volume fraction, , of silicone oil for fast (3.85 s−1; filled circles) and slow (0.04 s−1; open circles) values of the strain rate, . Error bars represent standard deviations; where error bars are not shown, they are smaller than the data points. Regression lines plotted through each set of data points have R2 = 0.98.