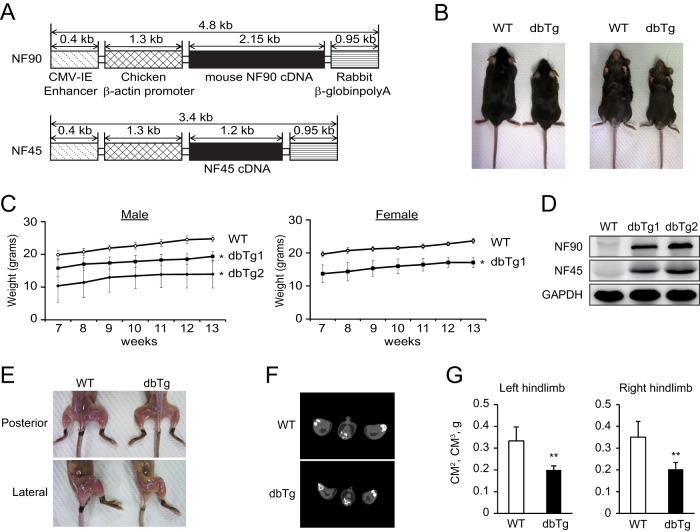
FIG 1.
NF90-NF45 dbTg mice exhibit atrophy of skeletal muscle. (A) Transgene constructs of NF90 and NF45 used to generate dbTg mice. (B) Representative photographs of WT and dbTg1 mice at 15 weeks of age. (C) Growth curves of WT (n = 7), dbTg1 (n = 7), and dbTg2 (n = 3) mice (male) and those of WT and dbTg1 mice (female) (n = 7) at 7 to 13 weeks of age. Data are expressed as means ± standard deviations. *, P < 0.01 compared to the WT, determined by two-tailed Student's t test. (D) Western blot analysis of the levels of NF90 and NF45 in skeletal muscles of WT, dbTg1, and dbTg2 mice at 15 weeks of age. GAPDH was used as a loading control. (E) Visual observation of hindlimbs from WT and dbTg1 mice at 15 weeks of age. (F) Axial computed tomography images of the center of distal hindlimbs in WT and dbTg1 mice at 14 weeks of age. (G) X-ray computed tomographic analysis of the muscle masses of right and left hindlimbs in WT and dbTg1 mice at 14 weeks of age. Data are expressed as means ± standard deviations (n = 4). **, P < 0.01 compared to the WT, determined by two-tailed Student's t test.

