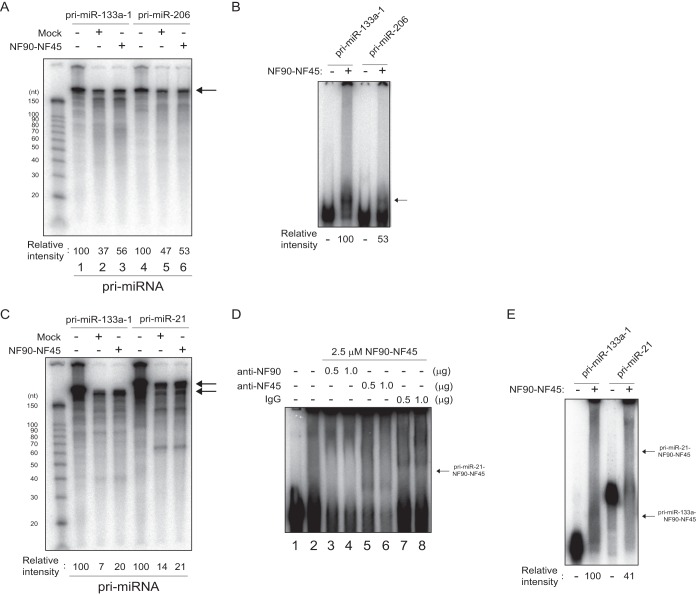
FIG 7.
Facilitation of pri-miR-206 and pri-miR-21 processing is caused by the low level of association of NF90-NF45 with pri-miRNAs. (A) Radiolabeled pri-miR-133a-1 and pri-miR-206 probes were incubated with whole-cell extracts of C2C12 cells transfected with expression plasmids. Processed RNA was separated on a 12% polyacrylamide-urea gel and visualized by autoradiography. The intensities of bands corresponding to pri-miR-133a-1 and pri-miR-206 were measured with a densitometer and are presented as relative band intensities. (B) EMSA performed with pri-miR-133a-1 or pri-miR-206 and recombinant murine NF90 and NF45. The intensities of bands corresponding to the specific RNA-protein complex indicated by an arrow were measured with a densitometer and are presented as relative band intensities. (C) Radiolabeled pri-miR-133a-1 and pri-miR-21 probes were incubated with whole-cell extracts of C2C12 cells transfected with expression plasmids. Processed RNA was separated on a 12% polyacrylamide-urea gel and visualized by autoradiography. The intensities of bands corresponding to pri-miR-133a-1 and pri-miR-21 were measured with a densitometer and are presented as relative band intensities. (D) An EMSA was performed with pri-miR-133a-1 and 2.5 μM NF90-NF45. The indicated amounts of anti-NF90 antibody (lanes 3 and 4), anti-NF45 antibody (lanes 5 and 6), or control normal rabbit IgG (lanes 7 and 8) were incubated with the recombinant proteins in binding buffer prior to probe addition. The position of the RNA-protein complex is indicated by an arrow. (E) EMSA performed with pri-miR-133a-1 or pri-miR-21 and recombinant murine NF90 and NF45. The intensities of bands corresponding to the specific RNA-protein complex indicated by arrows were measured with a densitometer and are presented as relative band intensities.

