FIG 6.
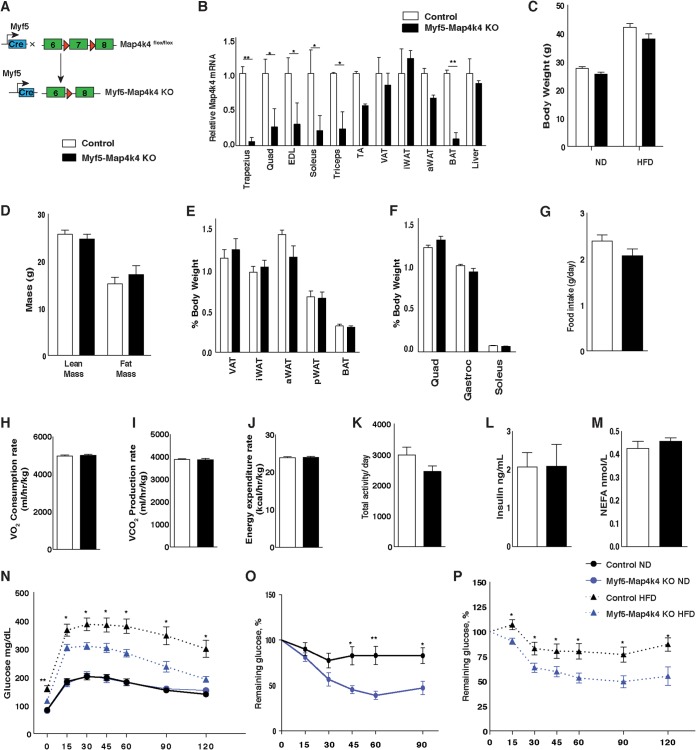
Map4k4 deletion in Myf5-positive tissues improves glucose tolerance and insulin responsiveness. (A) Schematic of alleles and transgenes used to inactivate Map4k4 using Myf5-cre knock-in allele. (B) Relative levels of Map4k4 mRNA expression in various muscles, adipose tissues, and liver (n = 5). Quad, quadriceps; EDL, extensor digitorum longus; TA, tibialis anterior. (C to M) Mice were fed an ND or an HFD for 8 weeks. (C) Body weight (n = 7 to 18). (D) Fat and lean mass analysis using 1H-MRS (n = 5). (E) Adipose tissues relative to body weight in ND-fed mice. Data represent visceral adipose tissue (VAT), inguinal subcutaneous adipose tissue (iWAT), axial subcutaneous adipose tissue (aWAT), perirenal adipose tissue (pWAT), and brown adipose tissue (BAT) (n = 8). (F) Muscle weight relative to body weight in ND-fed mice (n = 8). (G to M) Mice were fed an HFD for 8 weeks. (G) Food intake (n = 5). (H) Oxygen consumption rate (n = 5). (I) Carbon dioxide production rate (n = 5). (J) Energy expenditure rate (n = 5). (K) Total activity levels (n = 5). (L) Fasting insulin levels (n = 6 to 8). (M) Fasting NEFA levels (n = 5). (N) GTT (n = 7 to 17). (O) ITT of ND-fed animals (n = 11 to 19). (P) ITT of HFD-fed animals (n = 7 to 13). Results are means ± SEM (*, P < 0.05; **, P < 0.005).

