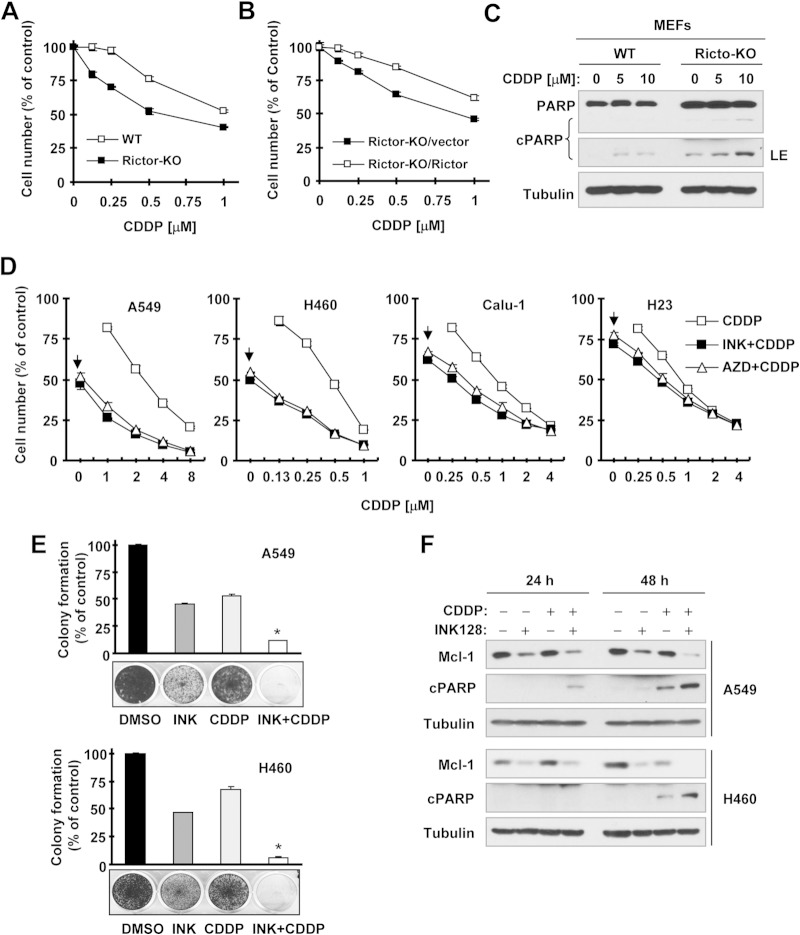
FIG 7.
Genetic (A to C) and pharmacological (D to F) inhibition of mTORC2 enhances the effects of CDDP in suppressing cell growth (A, B, D, and E) and in inducing apoptosis (C and F). (A and B) The indicated MEFs were exposed to the indicated concentrations of CDDP for 3 days. Cell numbers were then estimated with the SRB assay. Data are mean values of four replicate determinations. Error bars show standard deviations. (C) The indicated MEFs were treated with different concentrations of CDDP for 24 h and then harvested for preparation of whole-cell protein lysates and subsequent Western blotting. (D) The indicated cell lines were plated into the wells of 96-well cell culture plates and treated the next day with the indicated concentrations of CDDP alone, 20 nM INK128 or AZD8055 alone (as indicated by arrows), or a combination of CDDP with INK128 or AZD8055 for 3 days. Cell numbers were estimated with the SRB assay. Data are mean values of four replicate determinations. Error bars show standard deviations. (E) The indicated cell lines were seeded into the wells of 12-well plates at a density of approximately 400/well. On the second day, the cells were treated with DMSO, 20 nM INK128 or AZD8055, 0.5 μM (H460), or 1 μM (A549) CDDP or CDDP plus INK128 or AZD8055. After 10 days, the plates were stained for the formation of cell colonies with crystal violet dye and photographed with a digital camera. Columns show mean values of triplicate determinations. Error bars show standard deviations. *, P < 0.001 compared with all other treatments. (F) The indicated cell lines were exposed to DMSO, 20 nM INK128, 2 μM CDDP, or CDDP plus INK128 for 24 or 48 h. The cells were harvested for preparation of whole-cell protein lysates and subsequent Western blotting to detect the indicated proteins. cPARP, cleaved PARP; LE, longer exposure.

