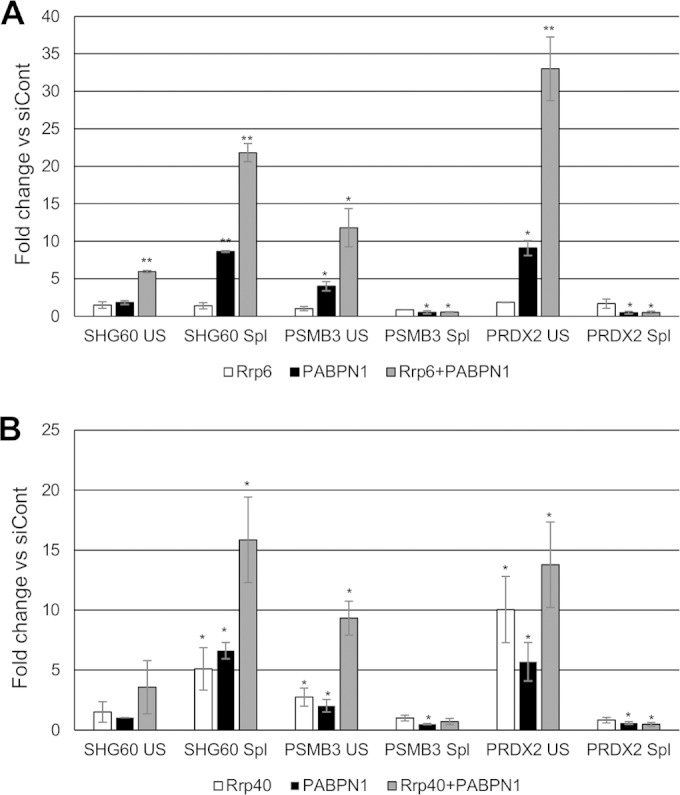
FIG 8.

The nuclear and core exosomes degrade PSMB3 and PRDX2 pre-mRNAs. (A) RT-qPCR analysis of control cells and cells depleted of Rrp6, PABPN1, or both Rrp6 and PABPN1. Spliced and unspliced SHG60, PRDX2, and PSMB3 transcripts were analyzed. Values are shown as fold changes relative to the levels in control samples following normalization to GAPDH mRNA. Note that PABPN1 effects are larger than those in previous figures because two rounds of siRNA transfection were performed. (B) RT-qPCR analysis of control cells and cells depleted of Rrp40, PABPN1, or both Rrp40 and PABPN1. Spliced and unspliced SHG60, PRDX2, and PSMB3 transcripts were analyzed. Values are shown as fold changes relative to the levels in control samples following normalization to GAPDH mRNA. Note that PABPN1 effects are larger than those in previous figures because two rounds of siRNA transfection were performed. All error bars represent standard deviations for at least three biological replicates. *, P < 0.05; **, P < 0.01.
