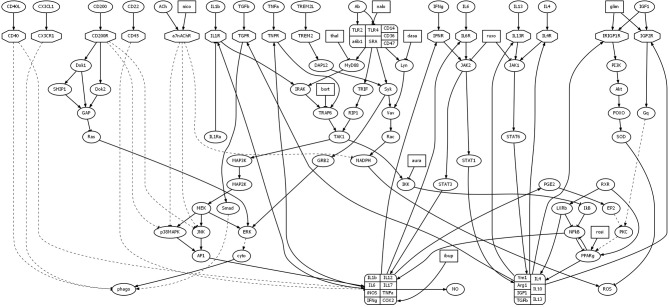
Figure 1.
Diagram illustrating model structure. The model analyzed here is based on a model of microglial behavior described previously (Anastasio, 2014), to which has been added 10 drugs and their direct effects. Nodes representing drugs are rectangular, those representing receptors are octagonal, and all other nodes are elliptical. Arrows and tees represent activating and suppressing connections, respectively. Solid and dashed curves represent direct and indirect connections, respectively. For abbreviations see Table 1 or Anastasio (2014).

