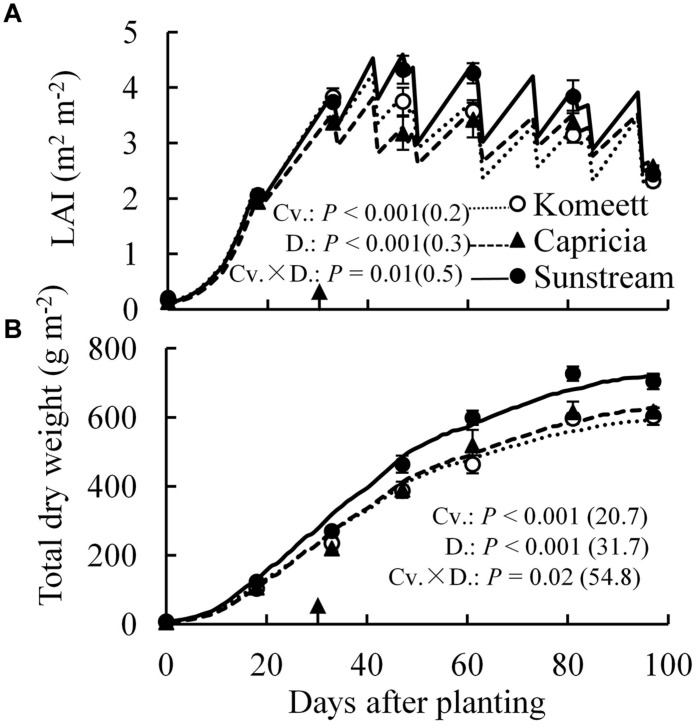
FIGURE 3.
Measured (symbols) and estimated (lines) LAI (A) and total dry weight (B) over time for three tomato cultivars with standard fruit load. Error bars through data points show ±SE (n = 6). The result of two-way ANOVA with cultivar (Cv.) and days after planting (D.) as independent variables and their interaction (Cv. × D.) for each dependent variable is shown in each panel. The value in the bracket indicates the least significant difference at P = 0.05 (l.s.d). Arrow in X-axis indicates 30 days after planting. Fruit set started between 20–30 days after planting for the three cultivars. Therefore, the left side of arrow was defined as early growth stage, the right side of arrow was defined as fully fruiting stage.

