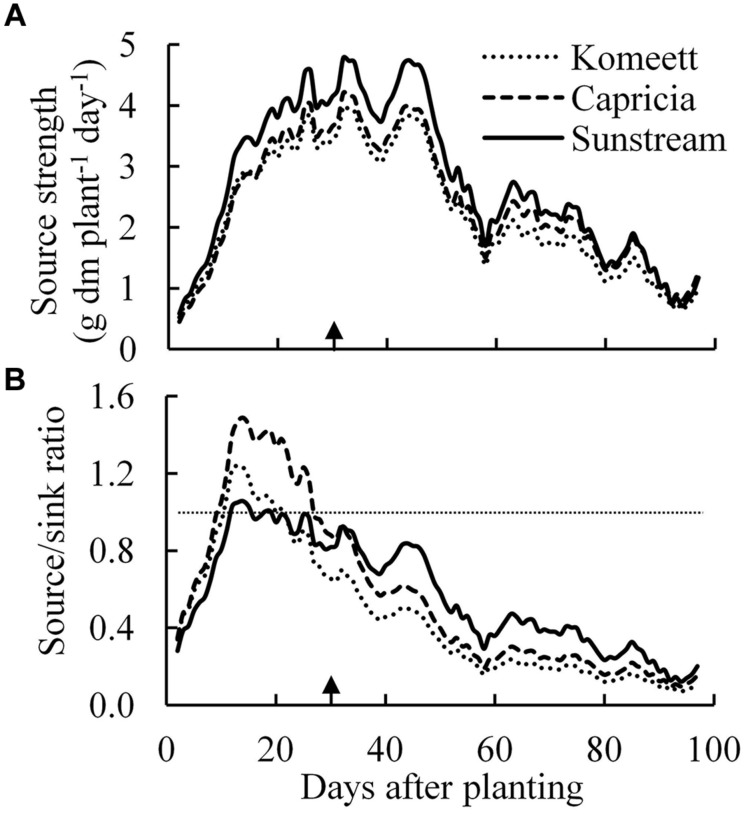
FIGURE 7.
Estimated source strength (crop growth rate; A) and source/sink ratio (B) over time for the three tomato cultivars with standard fruit load. Lines are moving averages over 5 days. Dashed horizontal line in (B) represents a source/sink ratio of 1. Arrow in X-axis indicates 30 days after planting. Fruit set started between 20–30 days after planting for the three cultivars. Therefore, the left side of arrow was defined as early growth stage, the right side of arrow was defined as fully fruiting stage.

