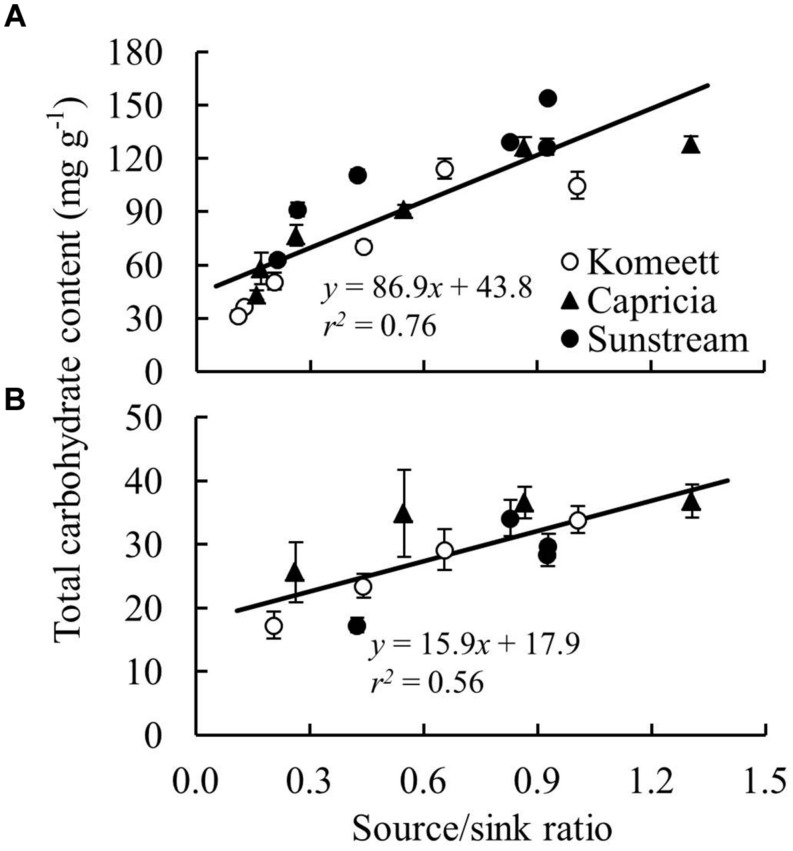
FIGURE 8.
The relationship between total carbohydrate content (sum of soluble sugar and starch content) and plant source/sink ratio in stems (A) and leaves (B) for three tomato cultivars with standard fruit load. Lines represent linear regression line. In (B), carbohydrate content determined at 81 and 97 days after planting (Figure 4D) were not included as these data were unexpected and remain unexplained.

