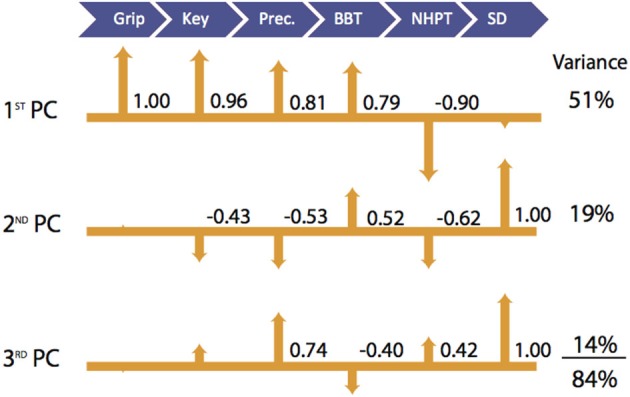
Figure 2.

Visualization of Latent Functional Domains in Participants with CMC OA. The scaled loadings for the outcome measures of the first three PCs are illustrated above. All loadings are shown, but numerical values are only listed if they are ≥ ±0.40. The signs of the loadings are indicated by the direction of the arrowheads.
