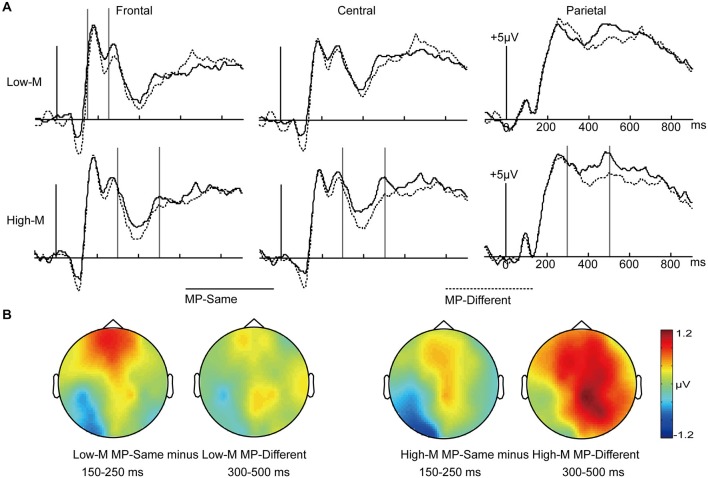
Figure 4.
ERPs for MP-Same and MP-Different trials as a function of High-M and Low-M. (A) Waveforms are shown from midline frontal electrodes to parietal electrodes. Gray vertical lines indicate the significant time windows (150–250 ms and 300–500 ms). (B) The left two topographical plots depict ERP differences between Low-M MP-same and Low-M MP-different; the right two topographical plots depict ERP differences between High-M MP-same and High-M MP-different.

