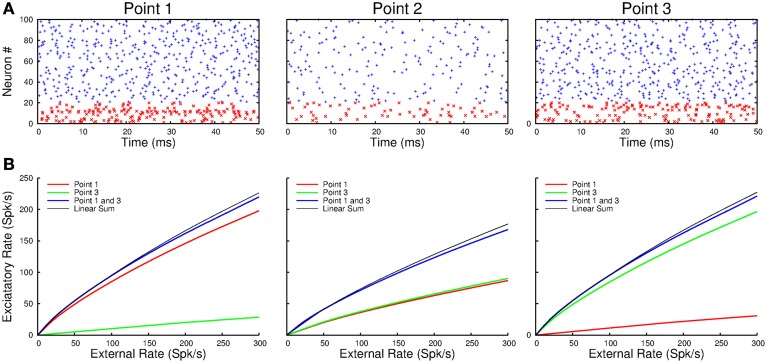
Figure 10.
(A) The raster plots show the spiking activity at points-1 and -3 when they are simultaneously activated by external inputs. Note that point-2, which receives no direct input in this example, responds more weakly. (B) The population response at each point varies nearly linearly with the external input. Moreover, simultaneous activation of, in this example, point-1 and -3 results in responses at each of the points which is the sum of the responses to their separate activation.

