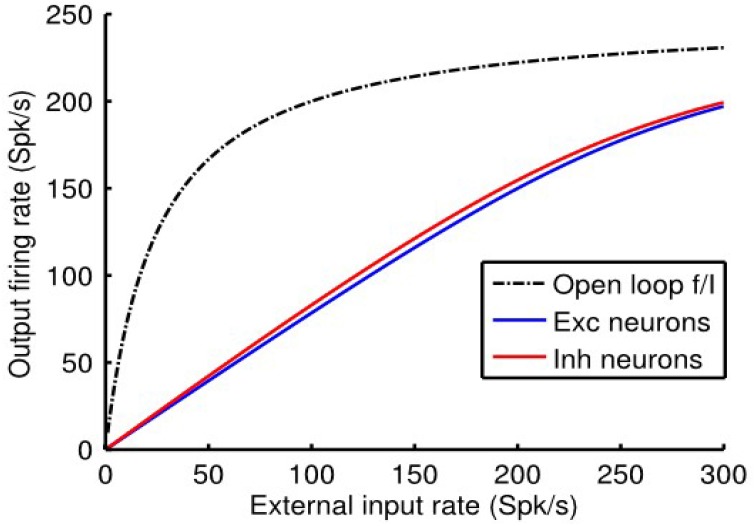
Figure 2.
Response of the single cortical point balanced network model to external input. Note the near linear f (I) curves of the e-cell and i-cell populations. By contrast, the dashed black curve depicts the non-linear response of the output e-cell population in the open loop mode. Model parameter values were qee = 0.67, qei = −1.7, qie = 1, and qii = −2.

