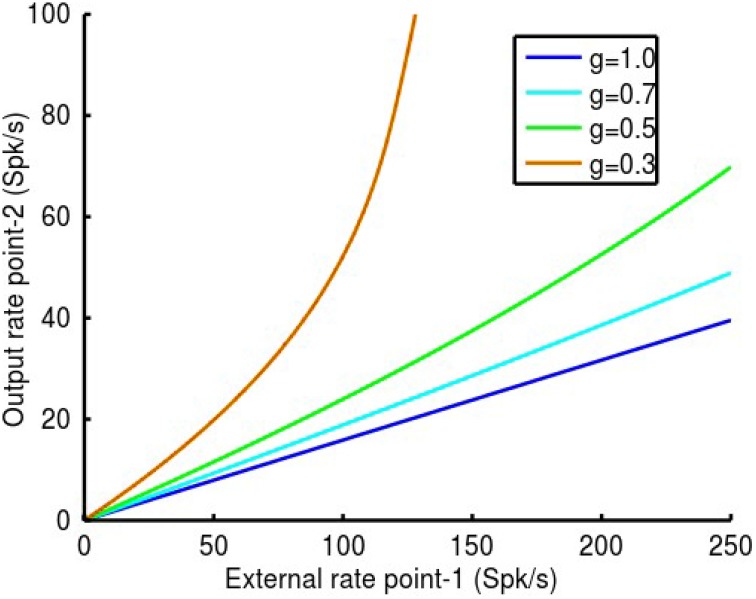
Figure 8.
In this example we show how MI-neurons control of the local i-cell population at point-2 modulates its response gain to inputs from point-1. The coupling strength between the two points was set at q12 = q21 = 0.2 and local inhibitory synaptic strengths, qii and qei, as in previous examples. Note that when the MI-neurons exert no effect on the local i-cell s, Gi-cell = 1. As Gi-cell is reduced, so to is the effectiveness of the local inhibitory feedback and consequently the response gain increases. As can be seen in the figure, point-2 responds linearly to inputs from point-1, and with increasing gain as Gi-cellis reduced. At a value nearing Gi-cell ≈ 0.5, a deviation from linearity is apparent beyond ~150 Spk/s. Thereafter, the response of point-2 becomes an accelerating function, as in the example with Gi-cell = 0.3. Thus, gain modulation by the MI-neurons maintains response linearity, but as expected, only over a limited range of 0.5 ≤ Gi-cell ≤ 1. This effectively means not much more than a gain doubling.

