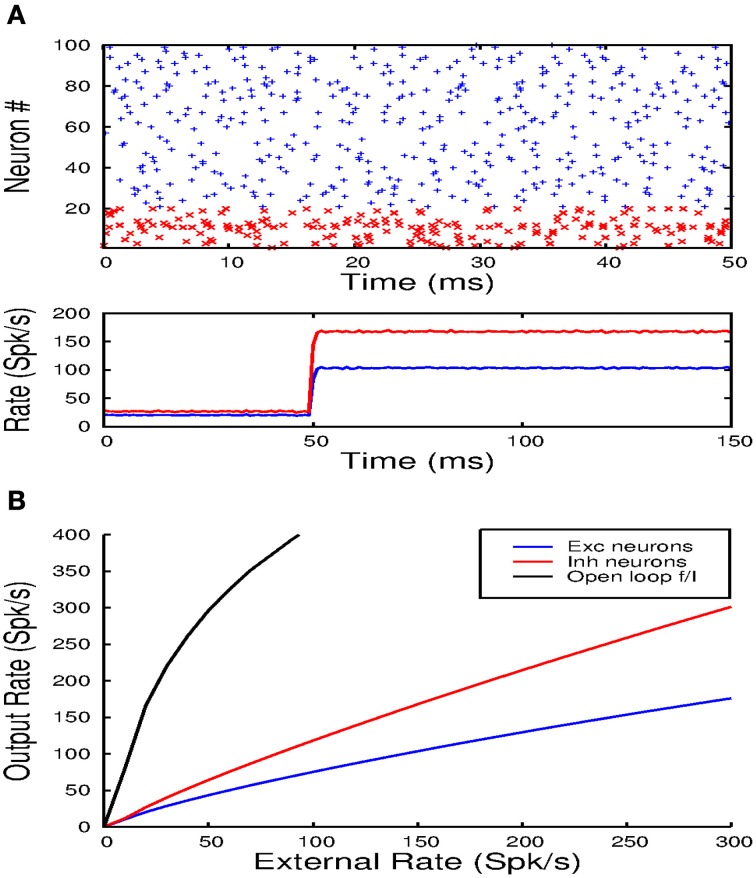
Figure 9.
(A) The top panel shows a raster plot of the firing times of 80 excitatory and 20 inhibitory units over a time interval of 50 ms. Note that activity is irregular and asynchronous. The lower panel shows the averaged population response to a step input from which it can also be inferred that the population activity is not synchronized. (B) Shows how the balanced network configuration linearizes and reduces the gain of the population transfer function.

