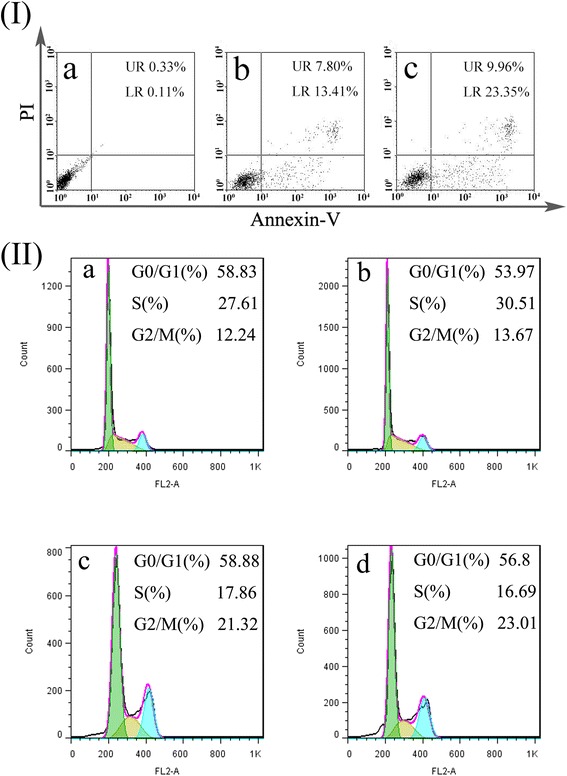
Fig. 4.

I FACS analysis of SGC-7901 cells stained with AnnexinV-FITC and PI. Cells did not treat with any agents as blank control (a), cells apoptosis induced by etoposide (b), cells treated with the ECCNBs (c). In all panels, LR represents early apoptosis and UR represents late apoptosis. II Analysis of cell cycle distribution by flow cytometry: SGC-7901 cells set as control group (a); SGC-7901 cells treated with CCNBs (b); SGC-7901 cells treated with etoposide (c) (30 μg/mL); SGC-7901 cells treated with ECCNBs (d)
