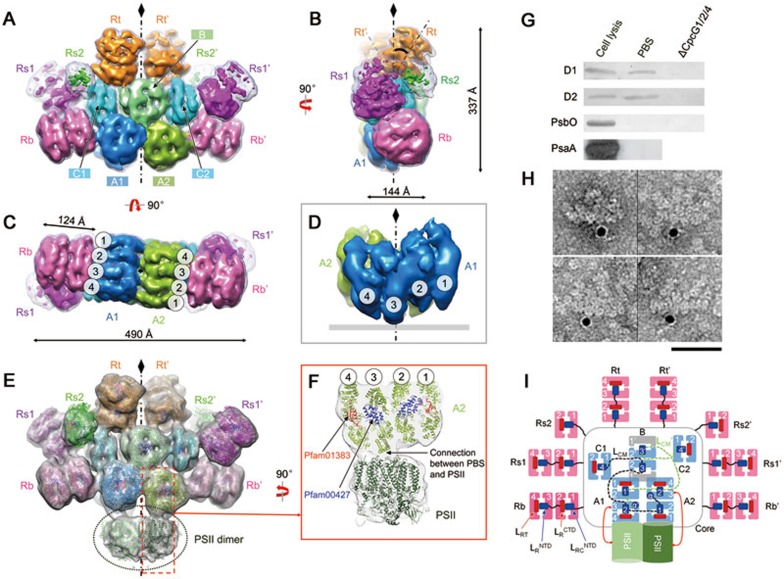
Figure 1.
Overall structures of the intact PBS and the PBS-PSII complex. (A-C) EM density map of the PBS from front (A), side (B), and bottom (C) views. Cylinders of the core (A1, A2, B, C1 and C2) and rods (Rb, Rs1, Rs2 and Rt) are shown in different colors. The low-pass filtered (to 20 Å) map is shown in mesh at the lower threshold to show the side rods, Rs1 and Rs2. The tilted angle of Rt with the symmetry axis is indicated at 35° (B). (D) Extracted density map of core A1 and A2 showing the protrusion of disc 3 to the membrane. (E) EM density map of the PBS-PSII complex. Densities corresponding to PSII are circled. Available crystal structures of APC or PC trimers, linker domains (Pfam00427 and Pfam01383) and the PSII dimer are docked into the density map. (F) Zoomed view of the connection between PBS and PSII through disc 3 of the A2 cylinder. (G) Immunoblotting demonstrating that the reaction center subunits D1 and D2 of PSII can be detected in the PBS sample. Lane 1, cell lysis as a positive control; lane 2, PBS sample used for EM analysis in this study; lane 3, PBS sample taken from the ΔcpcG1/2/4 mutant (in which all core-rod association-related genes are deleted) as a negative control. (H) Immunogold labelling EM of PBS preparation using antibody against PSII subunit D1. Scale bar, 500 Å. (I) Schematic model of the PBS-PSII architecture. Dashed lines indicate connections between the REP domains of LCM, which have not been experimentally verified. Blue box: the Pfam00427 domain; red box: the Pfam01383 domain.

