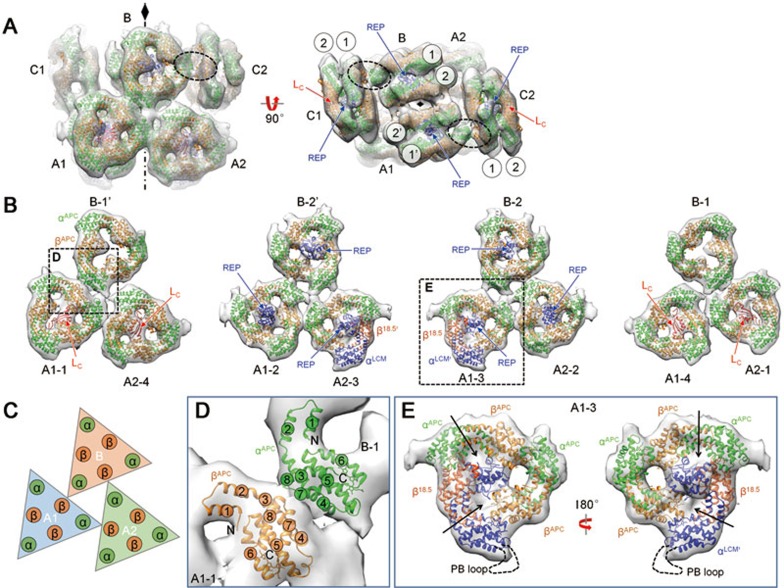
Figure 2.
Assembly of the core. (A) Extracted density map of the core with fitted crystal structures shown in side and top views. Connections between cylinders C and B via α-β subunit interactions are circled. (B) The inter-cylinder interaction in cylinders A1, A2 and B is shown layer by layer. (C) Schematic model showing the interaction of the inter-cylinder trimers. (D) Zoomed view of α-β interaction mediating the interaction of inter-cylinder trimers. Helices of each subunit are numbered from the N- to C-terminus. (E) Details of disc 3 docking, where the terminal emitter from LCM locates. The position of PB loop is indicated by a dashed line. The filled holes of the trimer are indicated with arrows.

