Figure 3.
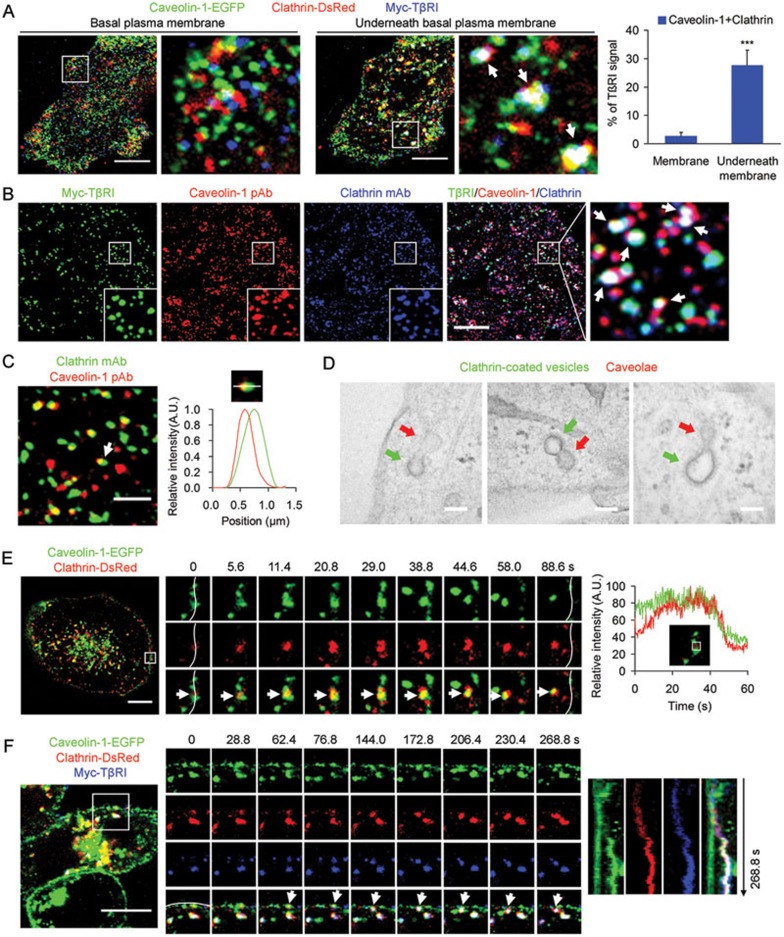
Fusion of clathrin-coated vesicles and caveolar vesicles underneath the plasma membrane. (A) The HeLa cell co-expressing caveolin-1-EGFP, clathrin-DsRed and Myc-TβRI was imaged at the basal plasma membrane plane or underneath the basal plasma membrane (the plane 1 μm above the basal plasma membrane) by confocal microscopy. The distribution of TβRI in caveolin-1 and clathrin double-positive vesicles was quantified (mean ± SD, n = 5 cells, ***P < 0.001, Student's t-test). (B) Myc-TβRI-expressing cells were immunostained with antibodies against caveolin-1 and clathrin and imaged by confocal microscopy. Myc-TβRI was labeled and then internalized for 15 min at 37 °C in the presence of TGF-β1. The triple-positive vesicles were marked by arrows in A and B. (C) HeLa cells were immunostained with antibodies against caveolin-1 and clathrin and imaged by confocal microscopy. The arrow-pointed vesicle is enlarged, rotated and shown on the right. The fluorescence of clathrin and caveolin-1 along the white line on the vesicle is shown. (D) Imaging the ultrastructure of the partially fused caveolar and clathrin-coated vesicles within cells by electron microscopy (green arrow, clathrin-coated vesicle; red arrow, caveolin-1-positive vesicle). (E) Live-cell spinning-disk confocal imaging of the middle plane of the cells co-expressing caveolin-1-EGFP and clathrin-DsRed. The boxed region was magnified (images to the right) to show the movement of a caveolin-1-EGFP and clathrin-DsRed double-positive vesicle (arrows) from the lateral plasma membrane (white lines) to the cytoplasm. The corresponding fluorescence time traces of the inset boxed region are shown. (F) Triple-color live-cell confocal imaging of the cell co-expressing caveolin-1-EGFP, clathrin-DsRed and Myc-TβRI. The boxed region was magnified (images to the right) to show the movement of a Myc-TβRI, caveolin-1-EGFP and clathrin-DsRed triple-positive vesicle (arrows) from the lateral plasma membrane (white lines) to the cytoplasm. The corresponding kymographs of these three molecules are shown. Scale bars, 10 μm (A, B, E, F), 2 μm (C), 100 nm (D).

