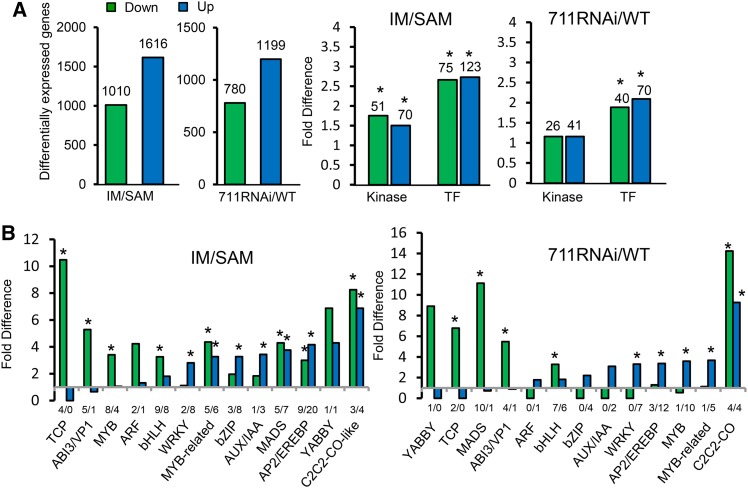
Figure 2.
Differential Gene Expression between IM and SAM and between SDG711 RNAi IM and the Wild Type.
(A) Left histograms: numbers of up- and downregulated genes (>2-fold, P value < 0.05) between IM and SAM and between SDG711 RNAi IM and the wild type (WT). Right histograms: numbers of protein kinase and transcription factor (TF) genes differentially regulated in IM compared with SAM or in SDG711 RNAi compared with the wild type. Significant enrichments (Fisher’s tests, P value <0.05) are indicated by asterisks.
(B) Relative enrichments of transcription factor families. Significant enrichments (Fisher’s tests, P value <0.05) are indicated by asterisks. Down/upregulated genes numbers are indicated below the bars. Fold changes are differences relative to the observed frequencies of specific subsets within the genome.

