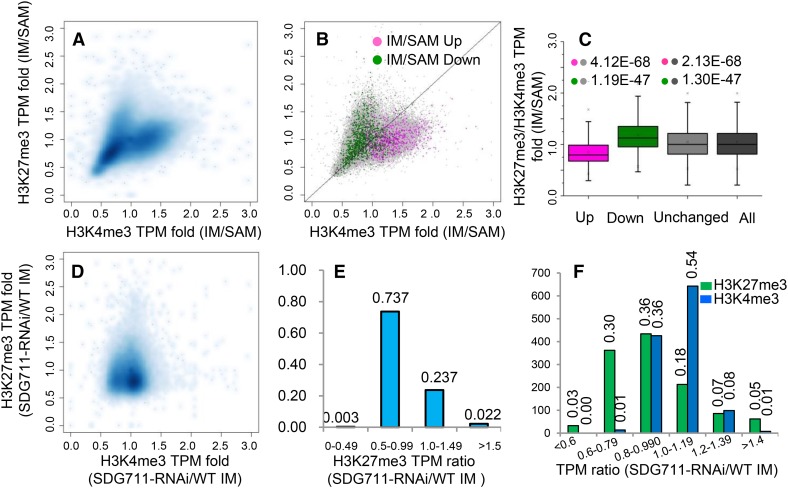
Figure 3.
Quantitative Changes (TPM) of H3K27me3 and H3K4me3 and Correlation with Differential Gene Expression between IM and SAM and between SDG711 and the Wild Type.
(A) Contour plots of H3K4me3 and H3K27me3 changes between IM and SAM.
(B) Distribution of up- and downregulated genes (>2-fold, P value <0.05) in IM compared with SAM.
(C) Box plots of up- and downregulated, unchanged, and all rice genes relative to H3K27me3/H3K4me3 ratio. P values (t tests) from comparison between differentially regulated gene and unchanged or all genes are indicated.
(D) Contour plots of H3K4me3 and H3K27me3 changes between SDG711 RNAi and the wild type.
(E) Distribution of different fractions of H3K27me3 TPM ratio between SDG711 RNAi and the wild type (WT). The ratio of ∼74% of genes was below 1. y axis, percentage of genes.
(F) Distribution of upregulated genes (>2-fold, P value <0.05) on TMP ratio fractions of H3K27me3 or H3K4me3 between SDG711 RNAi and the wild type. y axis, gene numbers.

