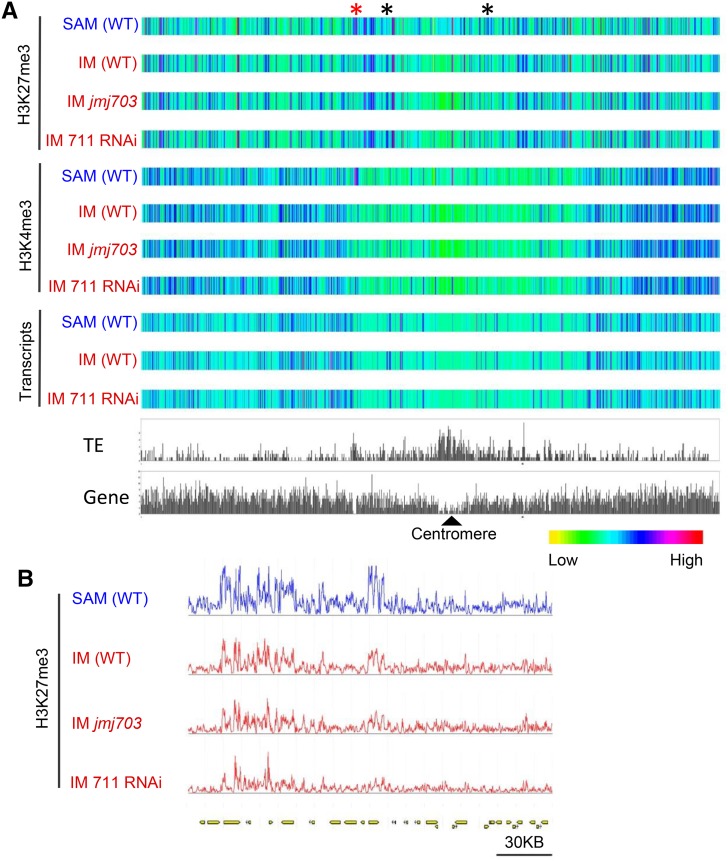
Figure 4.
Heat Map of H3K27me3 and H3K4me3 Levels and Transcript Abundance on Chromosome 3.
(A) Comparison between SAM and IM from different genotypes. Regions with clear difference between SAM and IM are indicated by asterisks. Relative abundance of TEs and genes of the chromosome are indicated.
(B) Close-up view of the H3K27me3-marked region indicated by the red asterisk.

