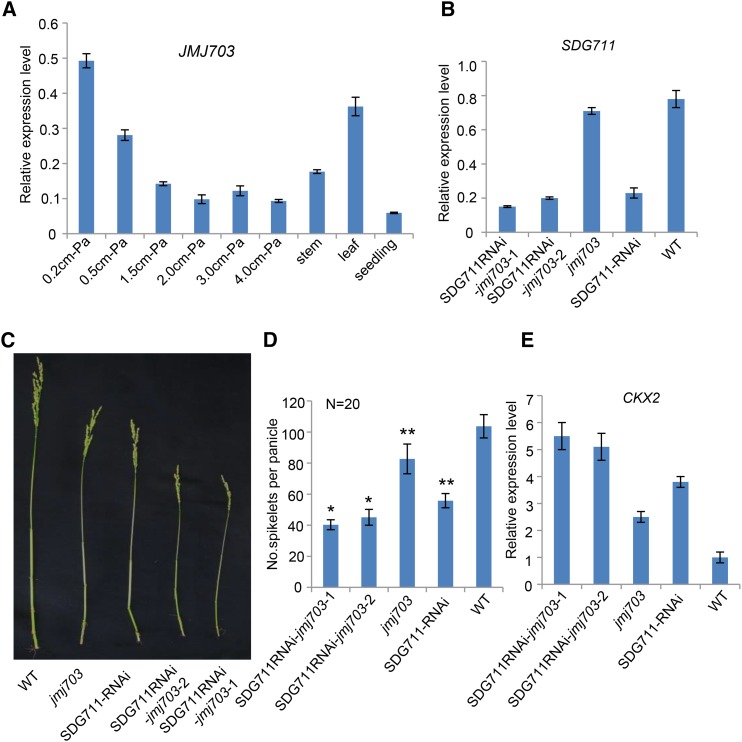
Figure 7.
SDG711 RNAi in jmj703 Mutant Background Further Reduced Panicle Size.
(A) Quantitative RT-PCR analysis of JMJ703 transcript levels (relative to ACTIN transcripts) in IM (at different stages), stem, leaf, and seedling.
(B) Relative transcript levels (to ACTIN) of SDG711 in jmj703, SDG711-RNAi, and the double knockdown/knockout lines compared with the wild type (WT).
(C) Panicle phenotype of the indicated genotypes.
(D) Spikelet numbers per panicle of the indicated genotypes. Bars = means ± sd from 20 panicles per genotype. Significant differences (Student’s t tests, P value <0.05) compared with the wild type are indicated by double asterisks (P value < 0.01). Significant difference between the double knockdown/knockout and SDG711 RNAi is indicated by single asterisks (P value < 0.05).
(E) Relative transcript levels (to ACTIN) of CKX2/Gn1a in IM of the indicated genotypes. For the RT-PCR data, bar = means ± sd from three biological repeats.

