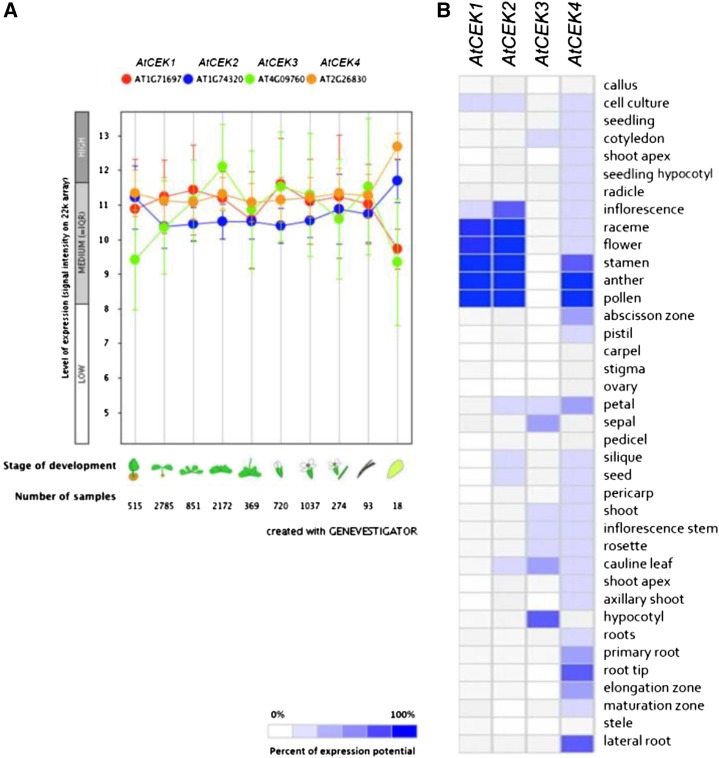
Figure 2.
Gene Expression Pattern of CEK1, 2, 3, and 4.
(A) Developmental stage-specific expression patterns. Left to right, germinating seed, seedling, young rosette, developed rosette, bolting rosette, young flower, developed flower, flowers and siliques, mature siliques, and senescence. “HIGH,” “MEDIUM,” and “LOW” expression were calculated by microarray assay. The number of samples indicates microarray gene expression data collected by Genevestigator.
(B) Heat map of tissue-specific expression pattern of CEK1, 2, 3, and 4. Data were analyzed with Genevestigator.

