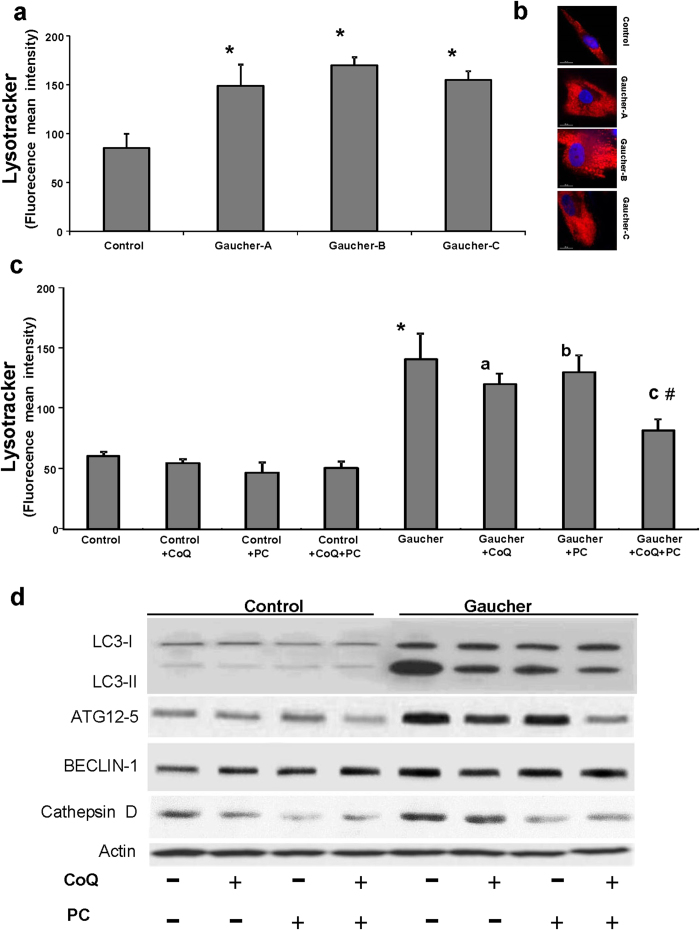
Figure 4. Increased expression of autophagic markers in Gaucher fibroblasts.
(a) Quantification of acidic vacuoles in control and Gaucher fibroblasts by LysoTracker staining and flow cytometry analysis. (b) Representative LysoTracker staining images in control and Gaucher fibroblasts. Scale bar= 15 μm. (c) Effect of CoQ, PC and CoQ + PC on the amount of acidic vesicules in Gaucher-B fibroblasts. Control and Gaucher fibroblasts were cultured in the presence or absence of CoQ (25 μM), PC NAdBT-AIJ (25 μM) or CoQ + PC (25 μM + 25 μM) for 96 h. Acidic vacuoles were quantified by LysoTracker staining and flow cytometry analysis. For control cells, the data are the mean ± SD for experiments conducted on 2 different control cell lines. Data represent the mean ± SD of 3 separate experiments. *p < 0.01 between control and Gaucher fibroblasts. ap < 0.05 between the presence and the absence of CoQ. bp < 0.05 between the presence and the absence of PC. cp < 0.05 between the presence and the absence of CoQ + PC. #p < 0.05 between CoQ + PC and CoQ or PC treatment. (d) The expression levels of LC3-I (upper band) and LC3-II (lower band), ATG12, BECLIN1 and cathepsin D were determined in the control and Gaucher-B fibroblast cultures by Western blotting. The ATG12 band represents the Atg12-Atg5 conjugated form. Fibroblast cultures were grown in normal culture medium or in medium supplemented with CoQ (25 μM), PC (25 μM) or the combination of both CoQ + PC (25 μM + 25 μM) for 96 h. Actin was used as a loading control. The densitometric analysis of Western blottings is showed in Supplementary Figure S6.

