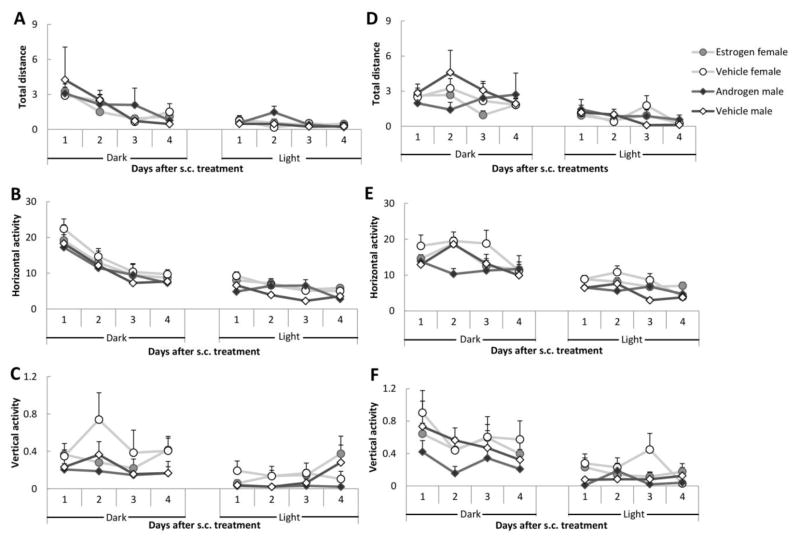
Figure 5.
Response to the tactile stimulus after s.c. administration. (A) Total distance during the tactile stimulus; (B) Horizontal activity during the tactile stimulus; (C) Vertical activity during the tactile stimulus; (D) Total distance during the 10 sec following the end of the tactile stimulus; (E) Horizontal activity during the 10 sec following the end of the tactile stimulus and (F) Vertical activity during the 10 sec following the end of the tactile stimulus. There were eight males and eight females in the experiment. Data are represent as mean ± SEM.

