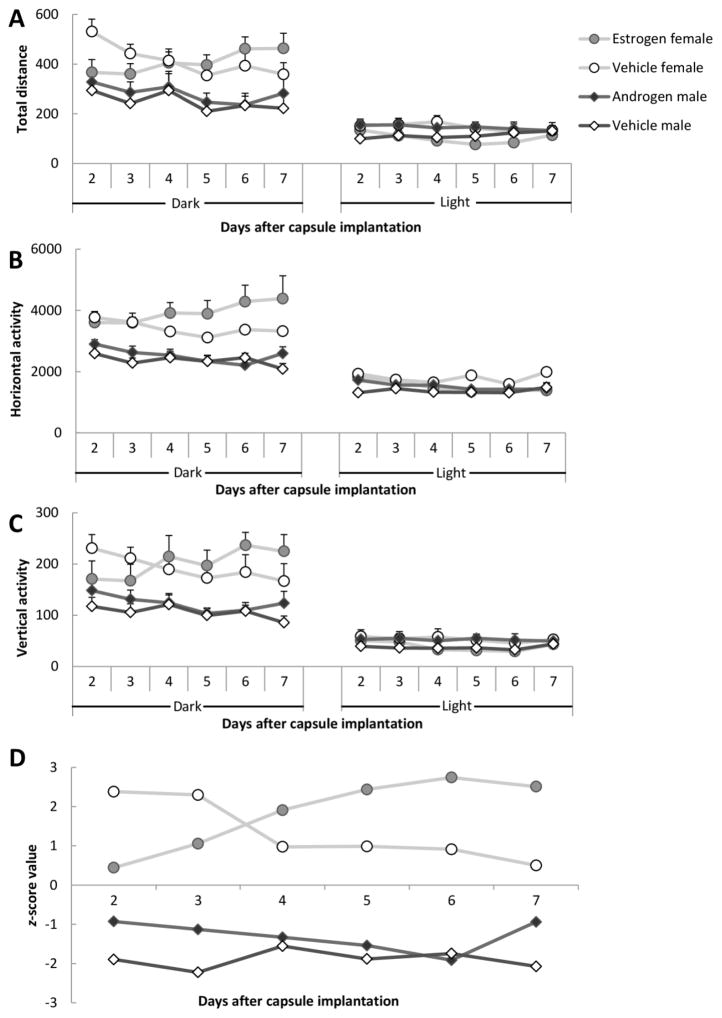
Figure 6.
Motor activity after hormone capsule implantation. (A) Total distance; (B) Horizontal activity; (C) Vertical activity and (D) Normalized values of total activity during the dark phase after hormone capsule implantation. Since total distance moved, vertical activity and horizontal activity showed a similar pattern we here illustrated total activity, the z scores from the three parameters were added, and the resulting sum is shown in the figure. There were eight males and eight females in the experiment. Data are presented as mean ± SEM.

