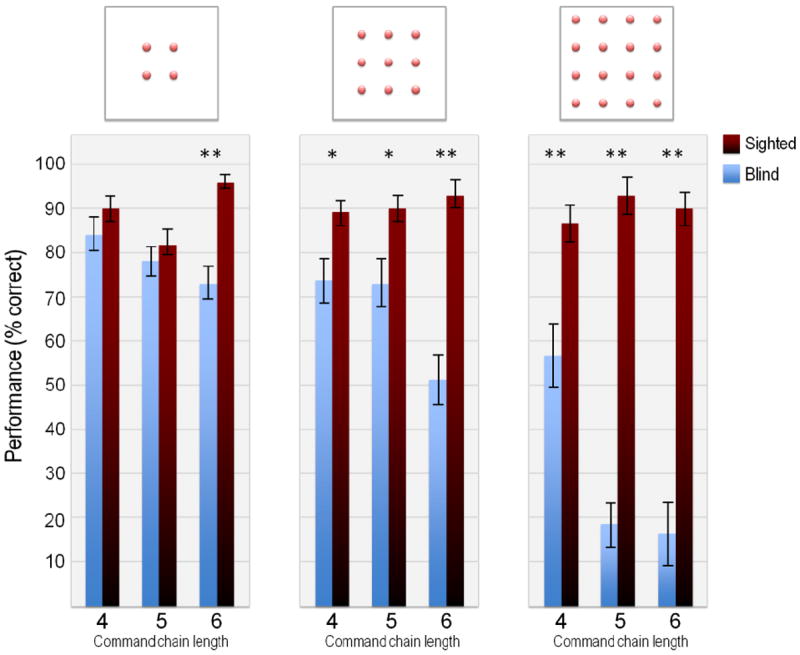
Figure 2.

Mean performance accuracy for blind and sighted (blindfolded) groups. The three panels correspond to different matrix sizes (2×2, 3×3 and 4×4) and the three bar pairs within each panel show performance on command chains of different lengths (4, 5 and 6). Level of statistical significance: *: 0.05, **: 0.01
