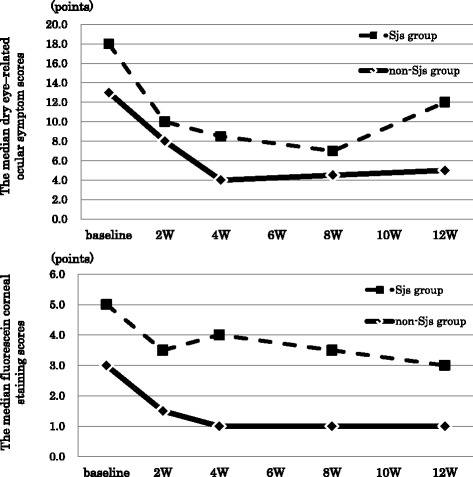
Fig. 1.

The scores of efficacy endpoints in Sjogren syndrome and non- Sjogren syndrome. The top row shows the time course analyses of dry eye–related ocular symptom scores at baseline, and at 2, 4, 8, and 12 week visits in Sjogren syndrome and non- Sjogren syndrome. The bottom row shows the time course analyses of fluorescein corneal staining scores at baseline, and at 2, 4, 8, and 12 week visits in Sjogren syndrome and non- Sjogren syndrome. Squares with dashed lines: Sjogren syndrome group. Diamonds with solid lines: non- Sjogren syndrome group; Values represent median. Corrected P value using the Bonferroni method was represented by Wilcoxon’s signed rank test. **P’ < 0.01 ***P’ < 0.001, P’ = corrected P value
