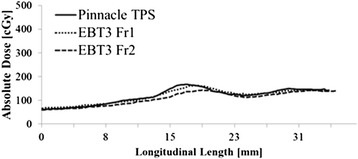
Fig. 5.

Longitudinal dose profile for EBT3 film sample. Absolute dose for a single patient as a function of the longitudinal film length plotted against the computed dose model. Good agreement was seen between EBT3 and the treatment planning system (TPS) model for the first and second fractions (Fr). Slight differences in curves were likely due to minute changes in EIS positioning from that at planning
