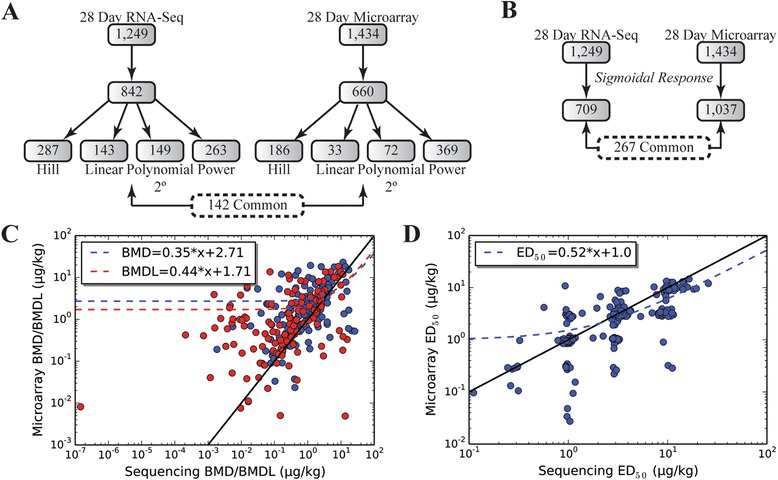
Figure 5.

Comparison of RNA-Seq and Agilent dose–response modeling. (A) The ToxResponse modeler [36] was used to identify genes fitting a sigmoidal response for the estimation of ED50s while (B) BMDExpress [35] was used to find the best fit curves for point of departure (BMD and BMDL) estimates. Correlation of (C) ED50s and (D) BMD (blue circles) and BMDL (red circles) estimates were examined for all comparable genes.
