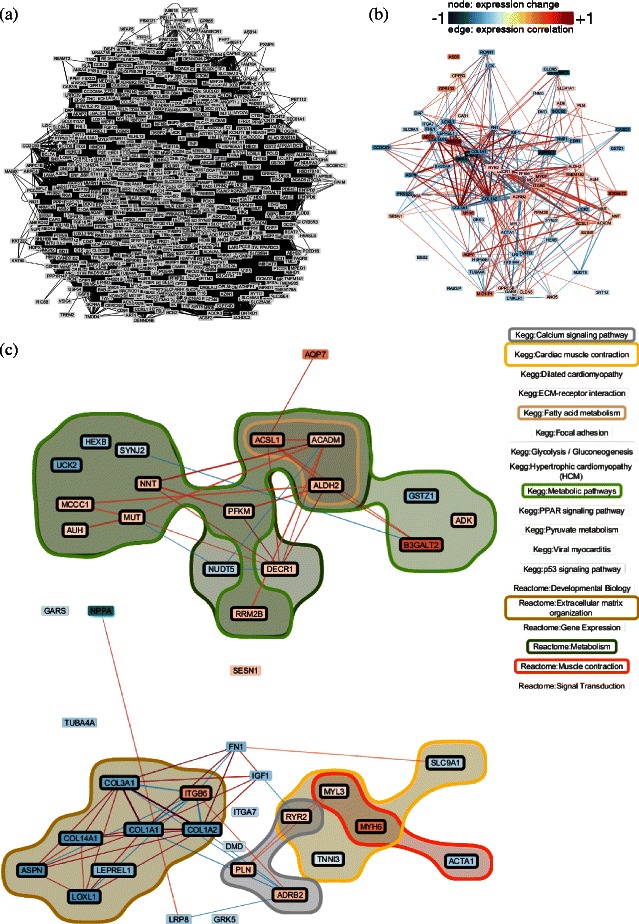
Figure 3.

Comparing myocardial gene expression findings with components of the β1-adrenergic signaling network.(a) The integrated data-knowledge network comprising 711 genes and 74,373 relationships between them. (b) Filtered subnetwork after applying two continuous DoI functions. In particular, the analyst used the statistical association of gene expression with LVEF response and the gene-expression correlation as DoI functions. In addition, the difference in the magnitude of change in gene expression was then mapped to the color of nodes and the gene expression correlation to the color of edges. (c) Further filtering and layout of the subnetwork in (b) based on two discrete DoI functions of interest: KEGG and Reactome. The subnetwork was laid out based on KEGG and Reactome pathways that are involved in heart function. Annotations related to metabolism, extracellular matrix organization, calcium signaling, or muscle contraction are selected to highlight genes associated with them.
