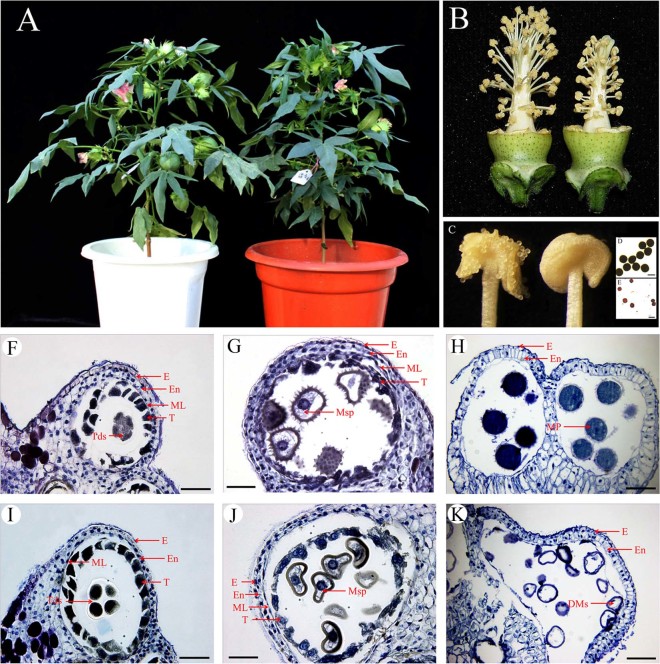
Figure 1. Phenotypic comparison between the 1355B and the 1355A lines.
(A) A 1355B plant (left) and a 1355A plant (right) at full-bloom stage. (B) A 1355B flower (left) and a 1355A flower (right), with petals removed. (C) In a 1355B anther (left), dehiscence is normal; while in a 1355A anther (right), dehiscence is abnormal. (D) 1355B pollen grains stained with 1% I2-KI solution at stage 12 showing mature pollen grains that are dyed black. (E) 1355A pollen grains stained with 1% I2-KI solution at stage 12 showing mature pollen grains that are not dyed black. (F–K) Locules from the anther section of the 1355B (F–H) and 1355A (I–K) plants during stage 7, stage 8 and stage 12. (F) and (I) stage 7. (G) and (J) stage8. (H) and (K) stage 12. There are no differences between the 1355B (F) and 1355A (I) plants at stage 7. Compared to those of the 1355B plant (G), the spines could not be identified on the surface of pollen in the 1355A plant (J). The microspore cytoplasm was stained deeply in the 1355B plants (H), but the microspores aborted in 1355A plants (K). E, epidermis; En, endothecium; ML, middle layer; T, tapetal layer; Mp, mature pollen; DMs, degenerated microspores; Msp, microspores and Tds, tetrads. Bars, 100 μm in (D) and (E); Bars, 50 μm in (F) to (K). Acknowledge the authors Yuanlong Wu and Li Yang for photographing (A), Yuanlong Wu for photographing (B), (D) and (E), and Zancheng Wu for photographing (C) and (F) to (K).

